Enhance your network visibility with Auvik Networks Add-on for Splunk
As networks grow more complex, troubleshooting blind spots with CLI log scraping is not sustainable. The Auvik Networks Add on for Splunk pulls rich inventory, interface and alert data from Auvik cloud into Splunk so you can see network behaviour next to application, endpoint and identity telemetry.
Auvik is a cloud network monitoring and management platform that discovers devices, builds maps and tracks health in near real time. It gives network teams the visibility they need to identify failing links, misconfigured gear and noisy devices long before users complain. The catch is that a lot of this power sits in a dedicated portal. When security and operations teams rely on Splunk as their central view, they need Auvik data available there as well. That is exactly what the Auvik Networks Add on for Splunk delivers by streaming structured network information into Splunk indexes you control.
Introduction to Auvik
Auvik focuses on giving IT teams an accurate map of what is on the network and how it is behaving. It discovers switches, routers, firewalls and other devices, tracks configuration and pushes alerts when something looks off. For distributed environments and managed service providers that need to watch many sites at once, Auvik becomes the primary source of truth for network inventory and health.
Connecting Auvik with Splunk lets you keep this context alongside the rest of your telemetry. When an application slows down or a security alert fires, you can pivot straight into device and interface information to see if the network is part of the story.
Seamless integration for enhanced monitoring
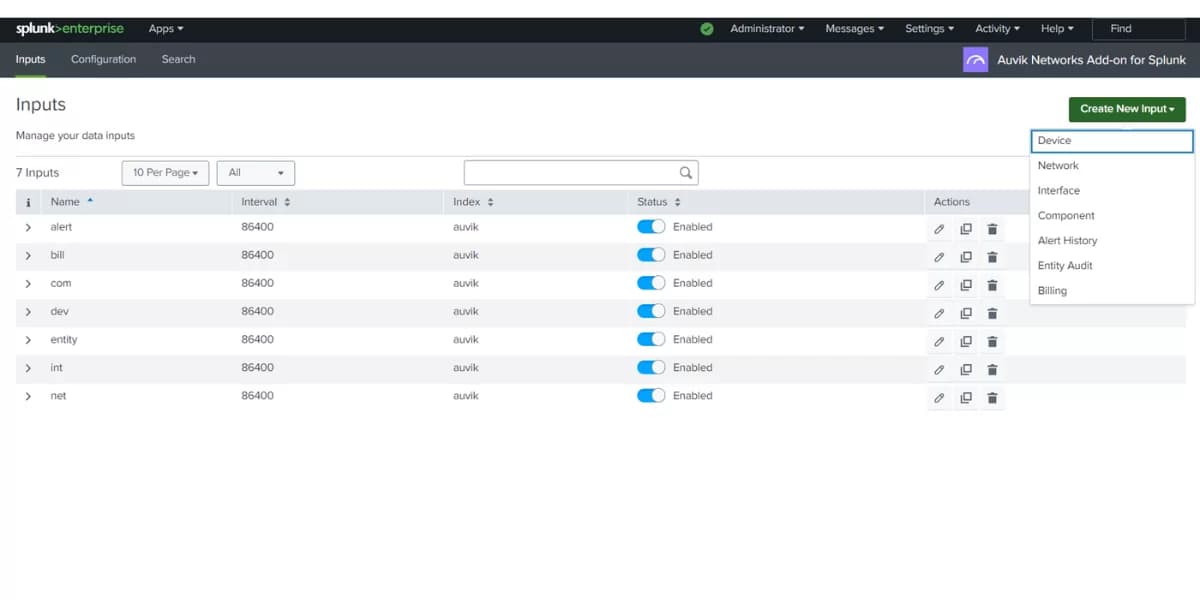
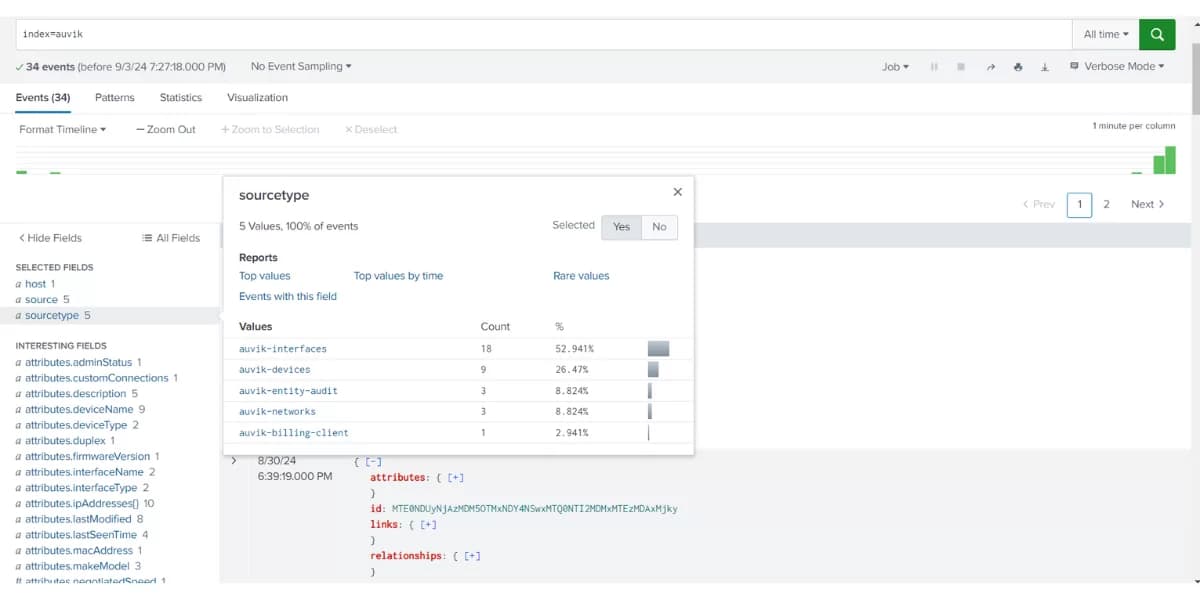
The Auvik Networks Add on for Splunk standardizes how Auvik data lands in Splunk. It provides inputs and sourcetypes that keep fields consistent, which makes correlation and dashboarding much easier.
Typical inputs from Auvik include:
- ✓Device inventory with model, role, site and status so you know what is under management and where it lives.
- ✓Network and interface information including utilization, errors and discards to help isolate noisy links and congested paths.
- ✓Component and entity data for important modules and clients that depend on those devices.
- ✓Alert history and billing insights so you can review incidents, track noisy sites and understand where network cost is going.
With those inputs in place, it becomes straightforward to build Splunk dashboards that show top failing devices, flapping interfaces and correlation with application or security events.
Why this matters for operations and security teams
When a ticket comes in, teams want to know quickly whether the network is the bottleneck or just another symptom. Without structured network telemetry in Splunk, answering that question turns into device by device checking, which costs time. With Auvik data in Splunk, you can search by site, device or interface, overlay alerts with application metrics and reach a decision much faster.
Conclusion
The Auvik Networks Add on for Splunk brings a reliable stream of network context into your existing logging and analytics stack. Combined with LogConnector, it gives you predictable ingestion, consistent fields and dashboards that highlight device health, interface pressure and alert trends. That helps operations, security and network teams work from the same data set instead of juggling separate tools and exports.
Ready to dive deeper into network visibility
In customer projects we help decide which sites to onboard first, how to size indexes for Auvik data and how to tie those views into existing Splunk searches and alerts. The outcome is a setup where questions about network health can be answered in a few searches and where network events are part of every major incident review.
Get in touch with us today
We work with teams that depend on Auvik to run their day to day network operations and want that visibility to extend into Splunk. That can mean better dashboards for NOC staff, more context for security investigations or clearer reports for leadership.
Once the integration is live you can measure real improvements like faster root cause analysis, better alignment between tools and reduced time spent jumping between consoles.
Talk to the team
Want Auvik data to show up where the rest of your logs live
We design and support LogConnector and Splunk configurations that pull Auvik telemetry into a clean data model with tested dashboards and alert patterns that match how your network is built.
Get in touch with us today
to learn more about:
- ›Benefits and features of Splunk and Auvik
- ›Our Splunk professional and development services
- ›Optimizing your Splunk infrastructure and reducing network troubleshooting time
Related Articles
Explore more guides where LogConnector and Splunk normalize cloud and security telemetry into focused dashboards with real operational value.
Streamline Azure Logs with LogConnector and CrowdStrike Falcon LogScale
Use LogConnector to route Azure platform and security logs into Falcon LogScale so cloud teams can see tenant, workload and identity activity in one place.
Read More
Streamline AWS Logs with LogConnector and CrowdStrike Falcon LogScale
Standardize CloudTrail, VPC Flow and application logs with LogConnector so AWS activity lands in Falcon LogScale with clean fields and better cost control.
Read More
Transforming Fortinet FortiGate Logs into Actionable Insights Using Falcon LogScale
Normalize FortiGate firewall events into security focused views that highlight blocked traffic, policy changes and risky hosts.
Read More