Transforming Zscaler Logs into Actionable Insights Using Falcon LogScale
Zscaler sits in the middle of user traffic and application access, which means its logs are full of clues about performance issues, risky behavior and policy gaps. The problem is volume and complexity. LogConnector continuously pulls Zscaler feeds into Falcon LogScale, normalizes them to a common schema and routes them into focused indexes so security and network teams can actually investigate, not just store data.
As more access moves through Zscaler, these logs become one of the richest sources of truth for who is connecting to what, from where and how well it is working. On their own they are noisy and hard to mine. Combined with Falcon LogScale you get cheap retention, fast search and the ability to line up Zscaler events next to endpoint, identity and infrastructure telemetry. The goal with this package is simple: make it painless to send the right Zscaler feeds into Falcon LogScale with structure that supports real investigations.
Introduction to LogConnector for Zscaler
LogConnector acts as the bridge between your Zscaler tenant and CrowdStrike Falcon LogScale. It handles authentication, offset management, transformation and delivery so you are not maintaining custom collectors for every ZIA or ZPA feed.
- Pulls logs from NSS Web, ZPA Auth, ZPA Audit and ZPA App feeds and flattens them into consistent event structures.
- Normalizes fields into the CrowdStrike Parsing Standard format so you can search by common names instead of memorizing product specific fields.
- Applies routing rules that send security heavy events to threat focused indexes and performance logs to operations indexes, which keeps queries clean and costs predictable.
Parsing Zscaler logs and turning them into dashboards
At the core of the package are the Zscaler parsers. They are built to understand the different record types ZIA and ZPA emit and to make them searchable without forcing analysts to learn every vendor nuance.
The parsers handle the heavy lifting:
- ✕No more guessing which feed a question belongs to. Traffic, access and audit events are aligned on common user, device and application fields.
- ✕Less time formatting timestamps or IPs. Normalization rules keep values consistent for joins and long horizon trend charts.
- ✕Reduced risk of blind spots when new fields show up. The CPS layout gives you a place to put them without rewriting your searches.
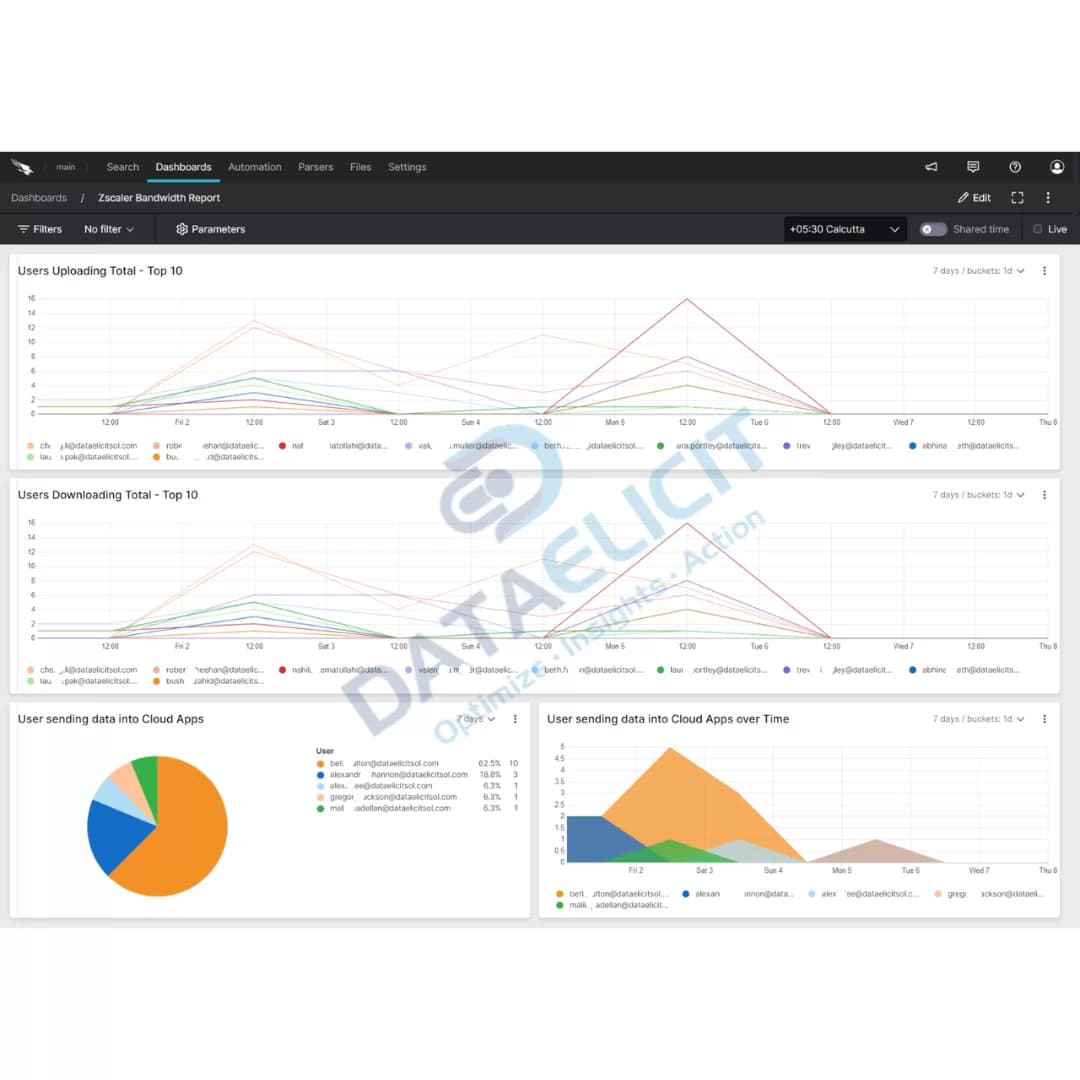
On top of the parsers sit pre built Falcon LogScale dashboards:
- ✓Web traffic and access control views that highlight risky destinations, blocked categories and high volume users.
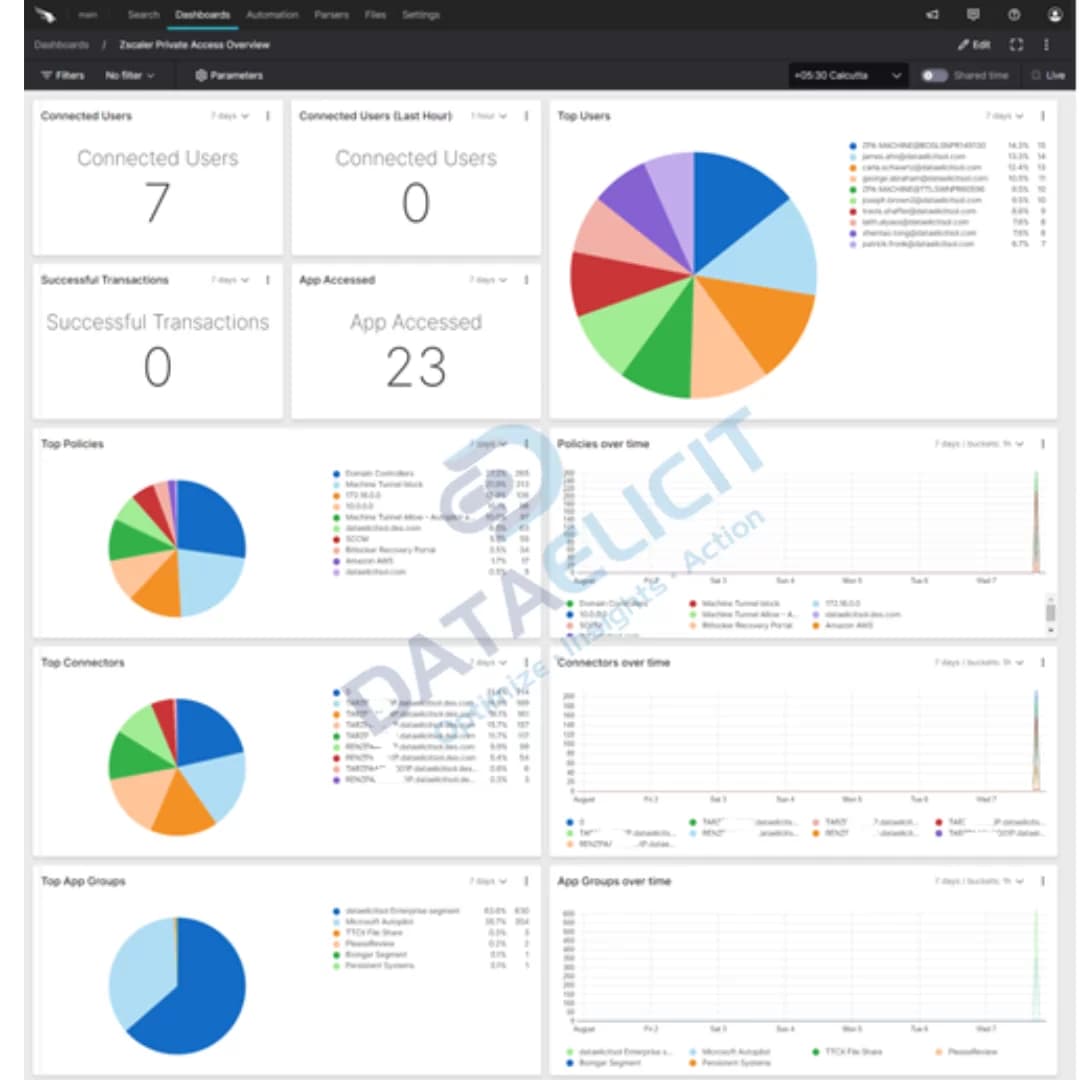
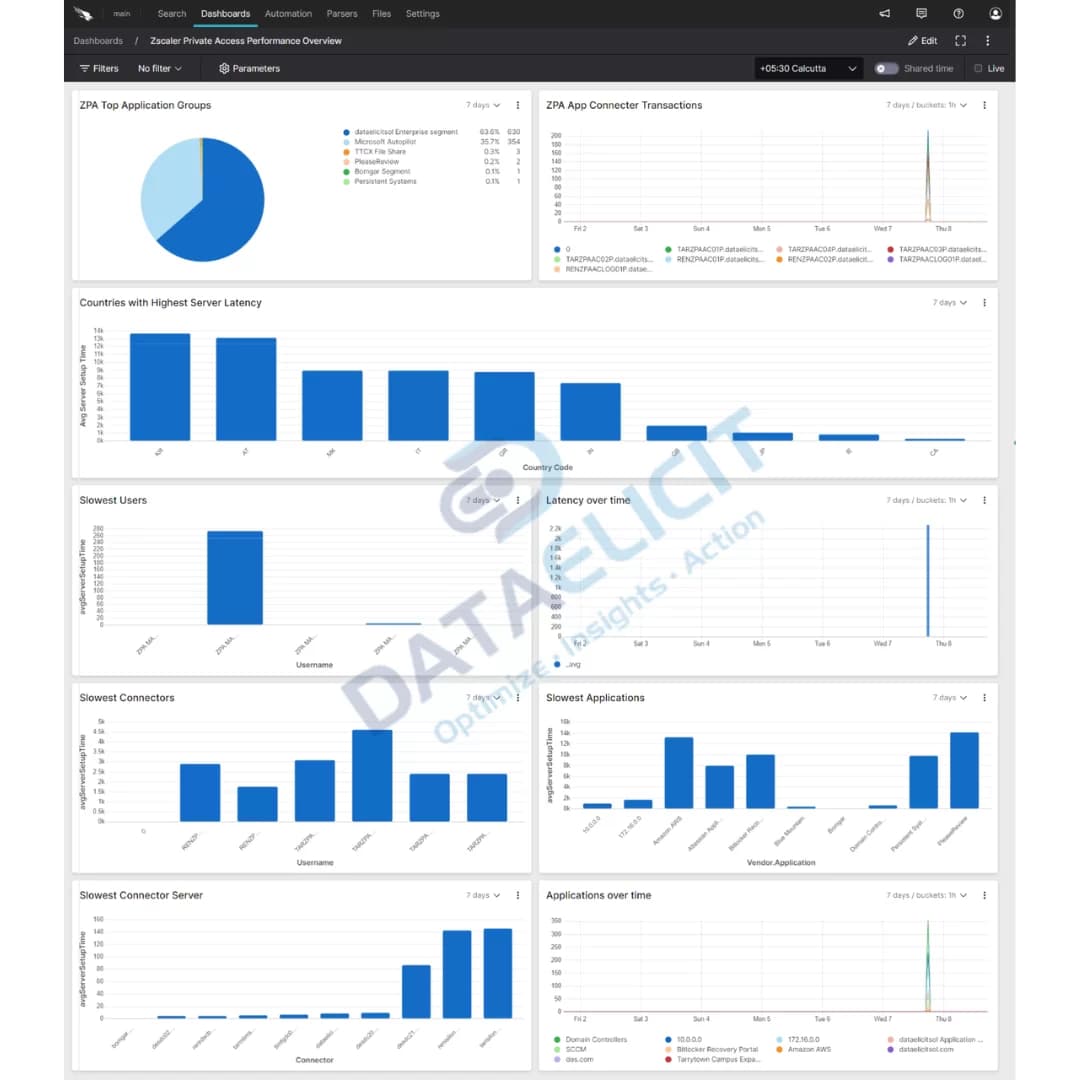
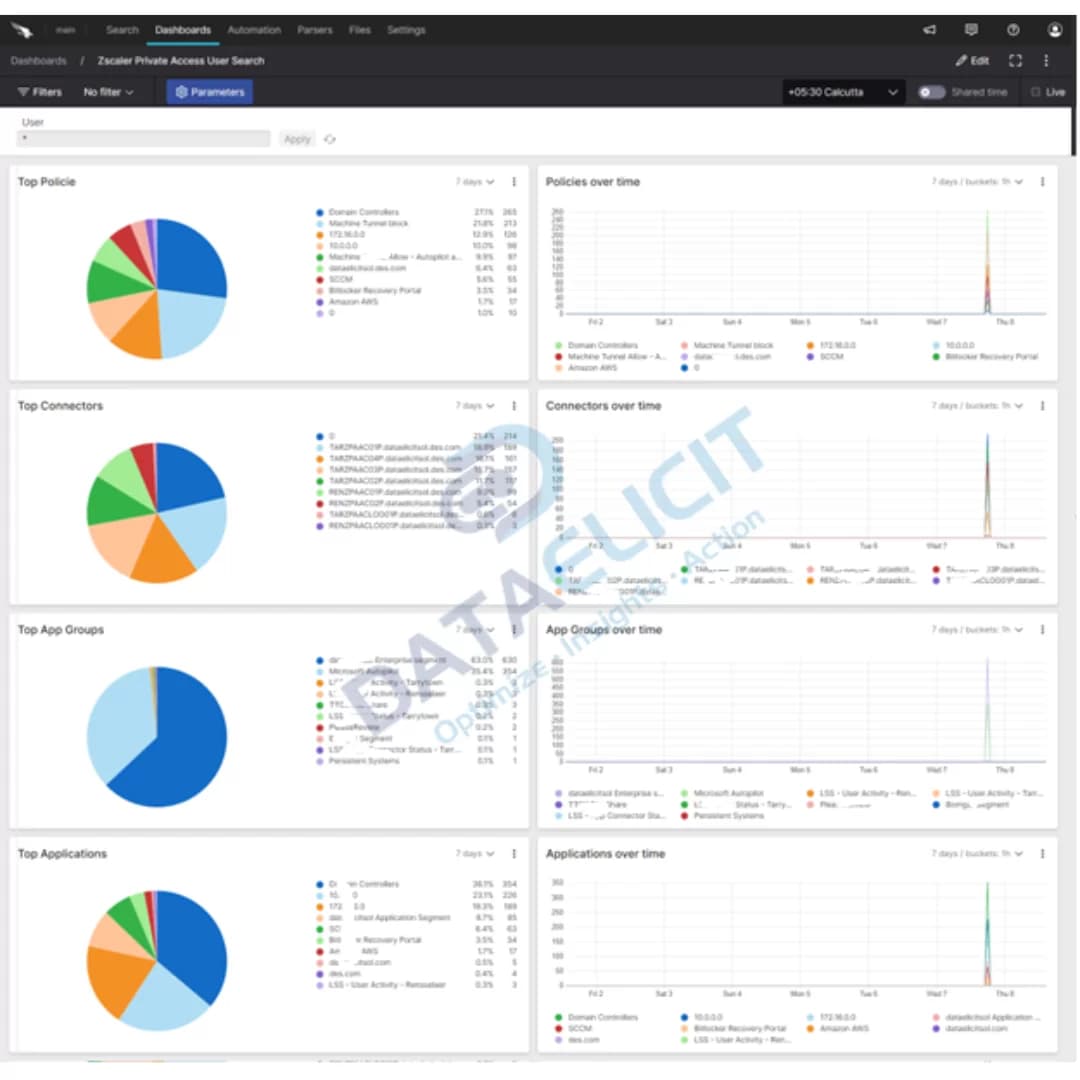
- ✓Private access performance panels that track connector health, latency and user search transactions.
- ✓Security and bandwidth reports that help SOC and network teams decide where to tighten policy and where to add capacity.
- ✓A foundation to blend Zscaler data with other Falcon LogScale sources such as identity providers or endpoint telemetry.
Once the parsers and dashboards are in place, Zscaler logs stop being a firehose and turn into a set of focused entry points: who accessed what, how well it worked and whether it was safe to allow.
Conclusion
Falcon LogScale plus LogConnector and the Zscaler package give you a practical way to use ZIA and ZPA logs instead of just archiving them. With structured ingestion, common schemas and dashboards that match how teams think, you can improve your network security posture, keep an eye on user experience and show clear value from the data you are already paying to generate.
Ready to dive deeper?
The examples here cover the core patterns. On real projects we help customers decide which Zscaler feeds to onboard, how long to retain them in Falcon LogScale and which questions matter most for their SOC and network operations teams.
Once ingestion is stable and dashboards are tuned, you can track concrete improvements: fewer unresolved tickets about slow access, faster answers for incident reviews and clearer evidence when you need to justify Zscaler spend.
Talk to the team
Need help making sense of your Zscaler logs?
We work with cloud security and network teams to stand up LogConnector driven pipelines from Zscaler into Falcon LogScale, with parsers and dashboards that match how your environment is actually built.
Get in touch with us today
to learn more about:
- ›LogConnector features and benefits
- ›The Zscaler package for Falcon LogScale
- ›How LogConnector and Falcon LogScale can enhance your IT and security operations
Featured Articles
Explore more integration guides and packages that combine LogConnector with Falcon LogScale for richer security analytics.
Enhance Threat Detection with Vectra XDR and CrowdStrike’s Falcon LogScale
Use Vectra XDR telemetry in Falcon LogScale to surface attacker behaviors that traditional alerts miss.
Read More
Gain Deep Visibility into Microsoft Active Directory with CrowdStrike Falcon LogScale
Stream AD security and operational logs into Falcon LogScale to investigate risky account activity in seconds.
Read More
Unlocking Key Insights from Akamai SIA Logs with CrowdStrike Falcon
Centralize Akamai Secure Internet Access events in Falcon LogScale so security teams can track DNS and web activity next to endpoint data.
Read More