Gain unified visibility across your infrastructure with Zabbix Add on for Splunk
Zabbix is often where infrastructure teams first see trouble, while Splunk is where security and operations teams pull the full story together. The Zabbix Add on for Splunk connects the two so critical alerts can be driven by Splunk searches and Zabbix audit data can be analyzed and retained in Splunk alongside the rest of your logs.
In modern IT environments, uptime and quick incident response are non negotiable. Zabbix is widely used for proactive checks and alerting, while Splunk is the place where teams investigate, report and correlate events across systems. Without an integration you get two partial views that are hard to connect. The Zabbix Add on for Splunk fixes that by providing a structured way to send important Splunk events into Zabbix and ingest Zabbix audit logs back into Splunk for deeper analysis.
How the Zabbix Add on for Splunk works
The integration focuses on two flows that are simple to operate but powerful when combined with good alerting and governance practices.
- Use Splunk searches and alerts to send only high value events into Zabbix, so on call engineers see meaningful incidents instead of noisy raw logs.
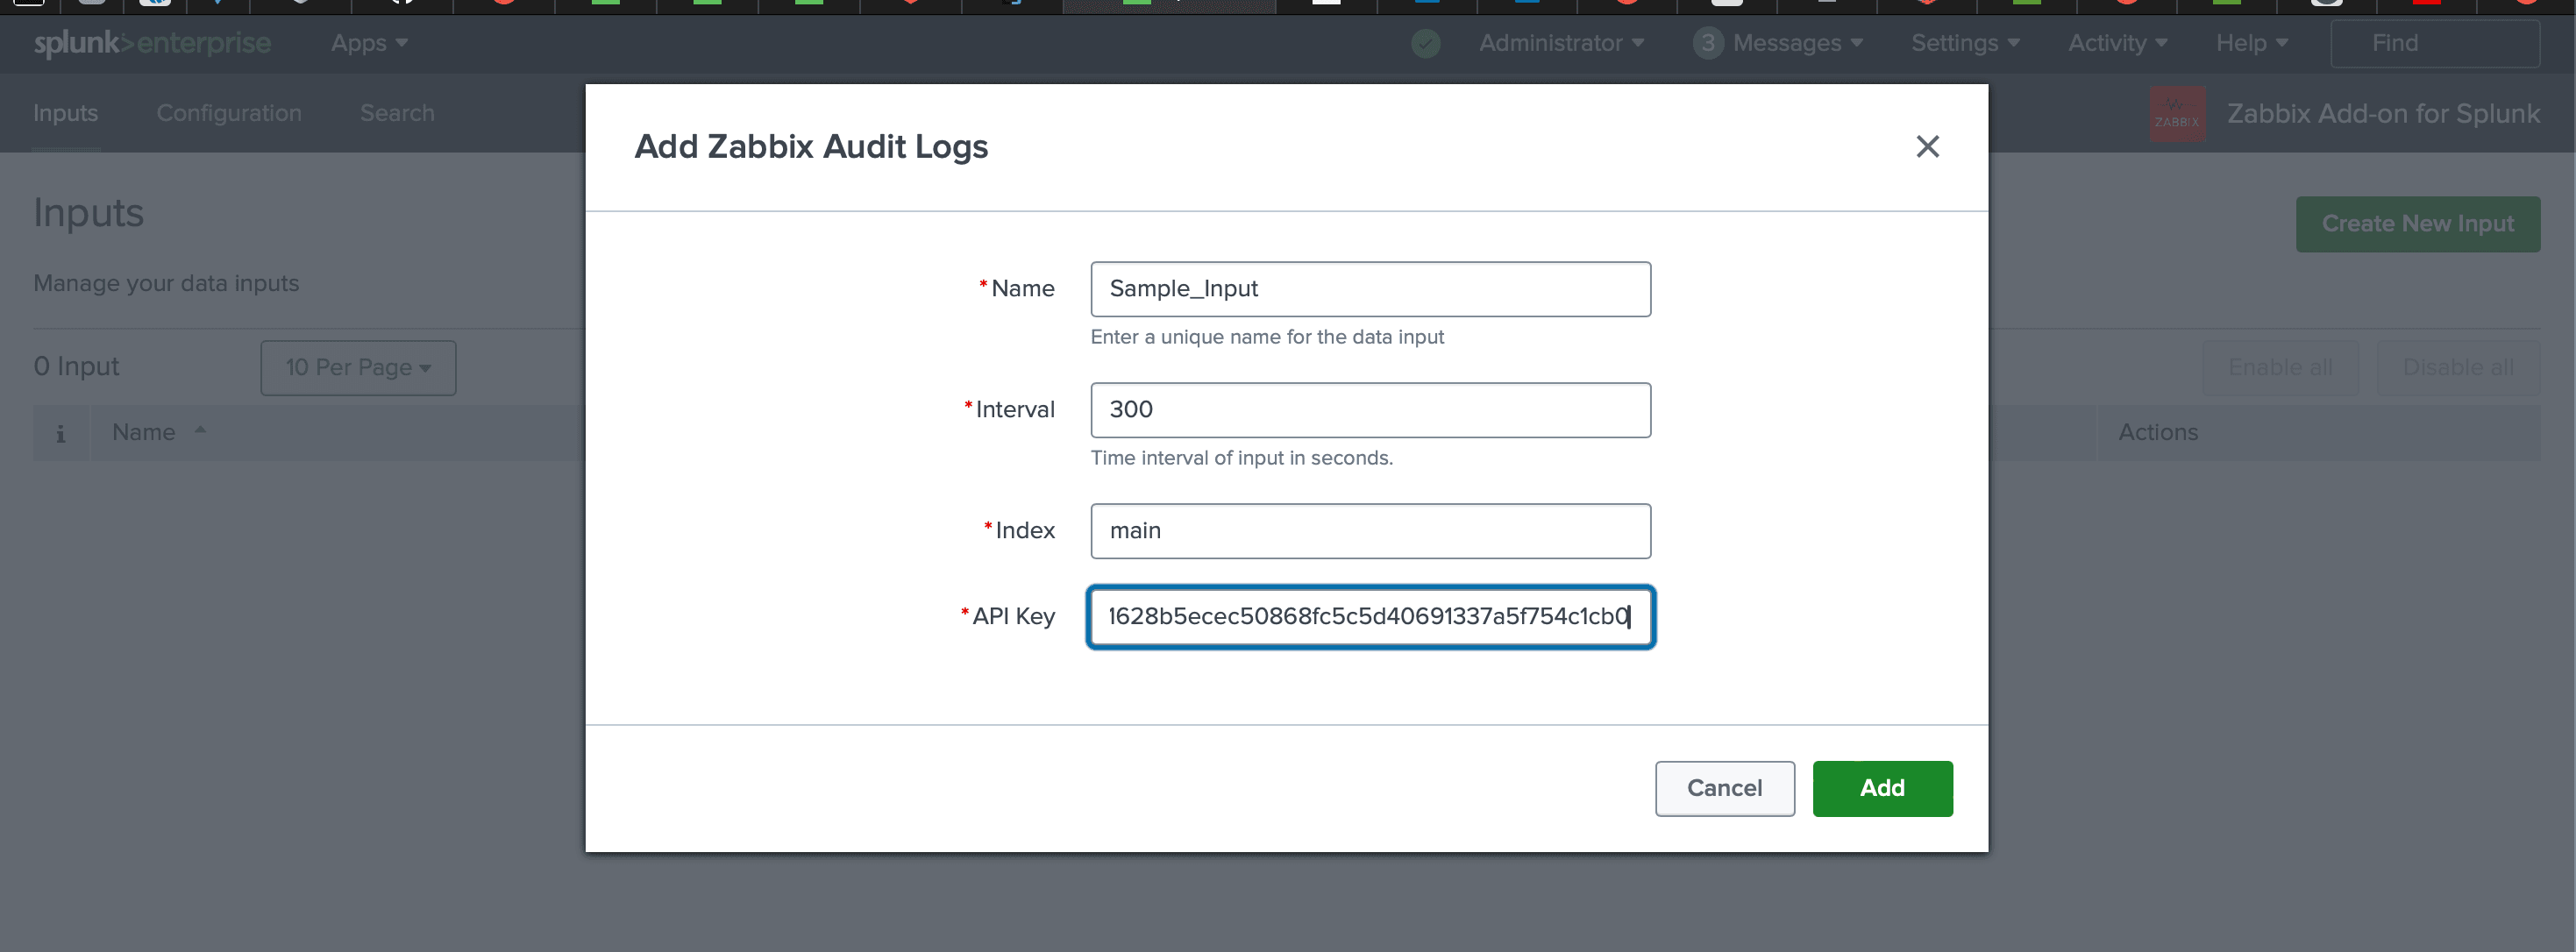
- Ingest Zabbix audit logs into Splunk to track who changed monitoring, which hosts were added or removed and how triggers evolved over time.
- Align changes and incidents in a single place so SRE, infrastructure and security teams can see cause, effect and ownership in the same views.
Why integrate Zabbix with Splunk
Combining Zabbix and Splunk gives operations and security teams one place to see alerts, configuration changes and long term patterns instead of piecing it together from separate tools.
Benefits of the integration include:
- ✓Centralized audit and analytics so Zabbix configuration changes sit alongside system logs and application events in Splunk.
- ✓Faster incident response, since engineers can pivot from a Zabbix alert directly into detailed Splunk queries for context.
- ✓Better governance with a clear history of monitoring coverage, who changed what and which services are protected.
- ✓Tighter feedback loops between observability, SRE and security teams using the same underlying data.
The result is fewer blind spots and a monitoring stack that reflects how your teams actually work instead of two tools competing for attention.
Conclusion
If you are aiming for a more cohesive IT operations ecosystem, the Zabbix Add on for Splunk is a practical upgrade. It lets Zabbix stay focused on real time checks and alerts, while Splunk handles deep search, reporting and investigations. The result is fewer blind spots, better context around incidents and stronger collaboration between infrastructure, operations and security teams.
Ready to dive deeper?
The overview here covers the main building blocks. In real deployments we help decide which Splunk searches should drive Zabbix triggers, which Zabbix audit streams belong in Splunk and how to align alerts with the services your teams care about most.
With Zabbix alerts and audit logs tied into Splunk, you gain faster incident response, cleaner audits and monitoring views that match how your infrastructure and SRE teams actually think about environments, clusters and services.
Get in touch with us today
to learn more about:
- ›Zabbix Add on for Splunk features and benefits
- ›Our Splunk and observability consulting services
- ›How Zabbix and Splunk together can strengthen your IT and security operations
Related Articles
Explore more guides that connect firewalls, network platforms and infrastructure tools with Falcon LogScale and Splunk for unified visibility.
Transforming Fortinet FortiGate Logs into Actionable Insights Using Falcon LogScale
Bring FortiGate firewall traffic, security and system events into Falcon LogScale so you can correlate policy changes and threat activity with endpoint and identity telemetry.
Read More
Transforming Palo Alto Firewall Logs into Actionable Insights Using Falcon
Normalize Palo Alto Networks firewall logs and stream them into Falcon LogScale so security teams can search, alert and report on traffic and threat events in one place.
Read More
Transforming Cisco IOS Device Logs into Actionable Insights Using Falcon
Ingest Cisco IOS syslog into Falcon LogScale with a structured schema that keeps interface, routing and security events easy to query for operations and security teams.
Read More