Route GCP Logs to CrowdStrike Falcon LogScale with LogConnector
Cloud teams ship a lot of workloads into GCP, but raw audit and platform logs get noisy fast. With LogConnector feeding Falcon LogScale, you standardize GCP telemetry, control ingestion cost and land dashboards that help SRE and security teams answer questions without juggling five consoles at once.
Keeping cloud workloads healthy means you need to see what is happening across compute, storage, networking and platform services in real time. GCP exposes a huge amount of telemetry, but it usually lives inside Cloud Logging, random Pub/Sub topics or export buckets that only a few engineers remember. Falcon LogScale gives you the search and analytics engine, but it expects clean, structured data. LogConnector is how you turn scattered GCP logs into a single, reliable stream into Falcon.
Introduction to LogConnector
LogConnector is a custom application that sits between your cloud environments and CrowdStrike Falcon LogScale. It handles collection, transformation and routing so your platform and security teams are not writing and maintaining ad hoc export scripts every time someone wants a new GCP source onboarded.
- Normalizes audit and platform logs into schemas that are easy to search and join inside Falcon LogScale.
- Adds lightweight enrichment so teams can pivot by project, service, instance, user or region without complex field wrangling.
- Routes only the events and fields you care about into dedicated Falcon indexes, keeping ingestion costs controlled and dashboards responsive.
Effortless onboarding and powerful analysis of Google Cloud logs
The GCP connector for LogConnector pulls telemetry out of Cloud Logging and related services and shapes it for Falcon LogScale. Instead of chasing exports across buckets and topics, you keep a single, predictable path into your log platform and build views that match how your teams actually operate.
GCP connector allows you to pull:
- ✓Pub or Sub messages that carry application and system events.
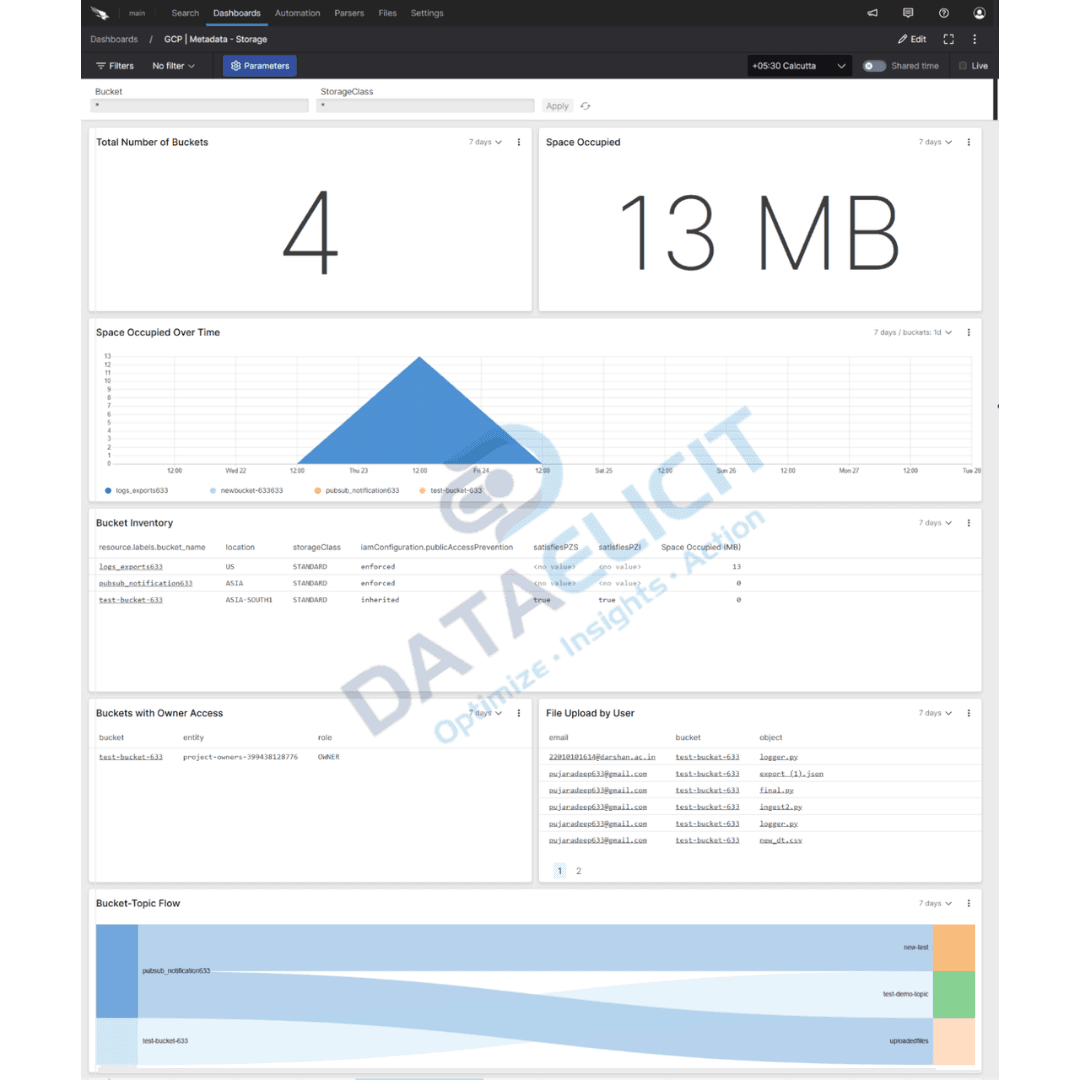
- ✓Generic data from GCS buckets used for log exports or batch telemetry.
- ✓Cloud Monitoring signals and metrics that give context around performance and health.
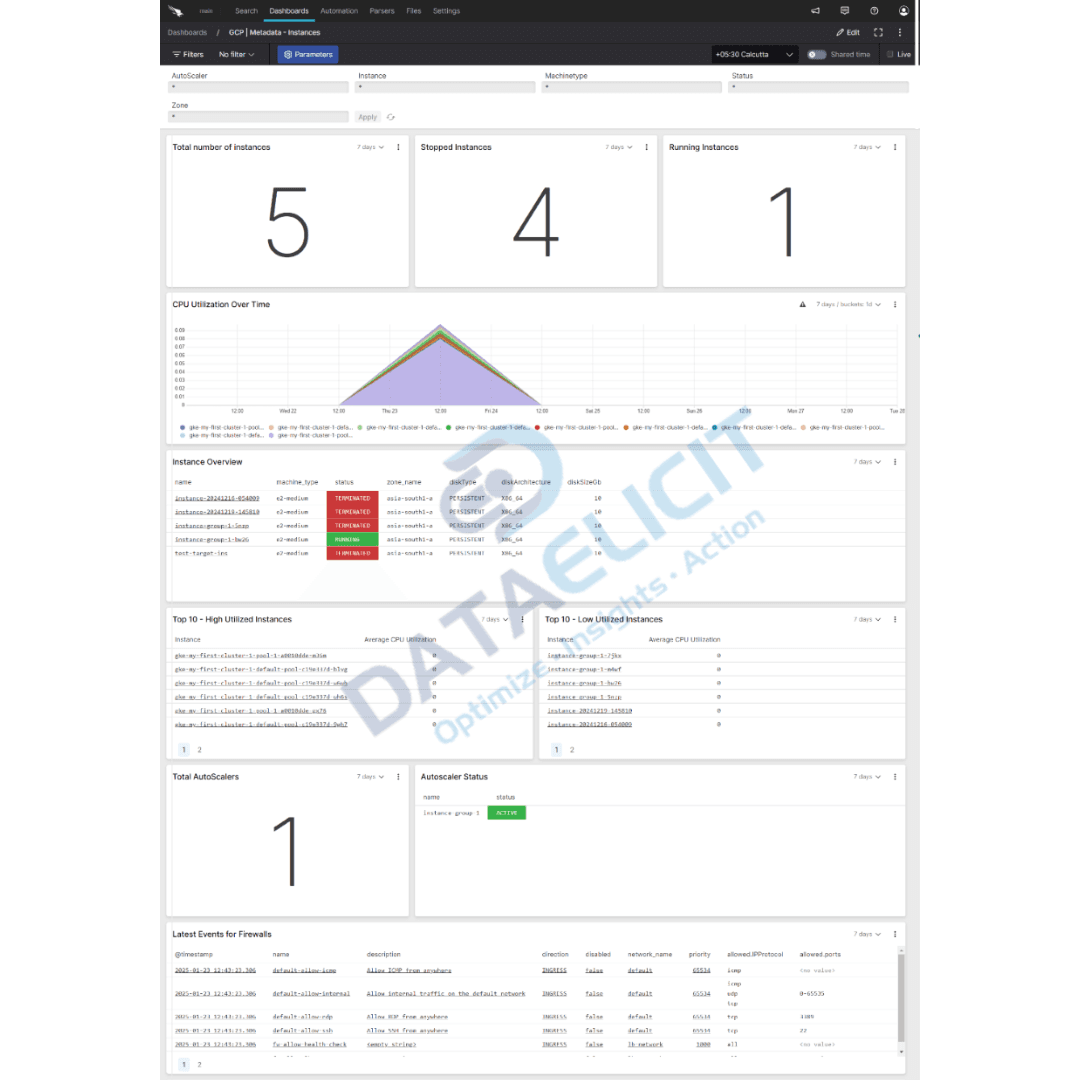
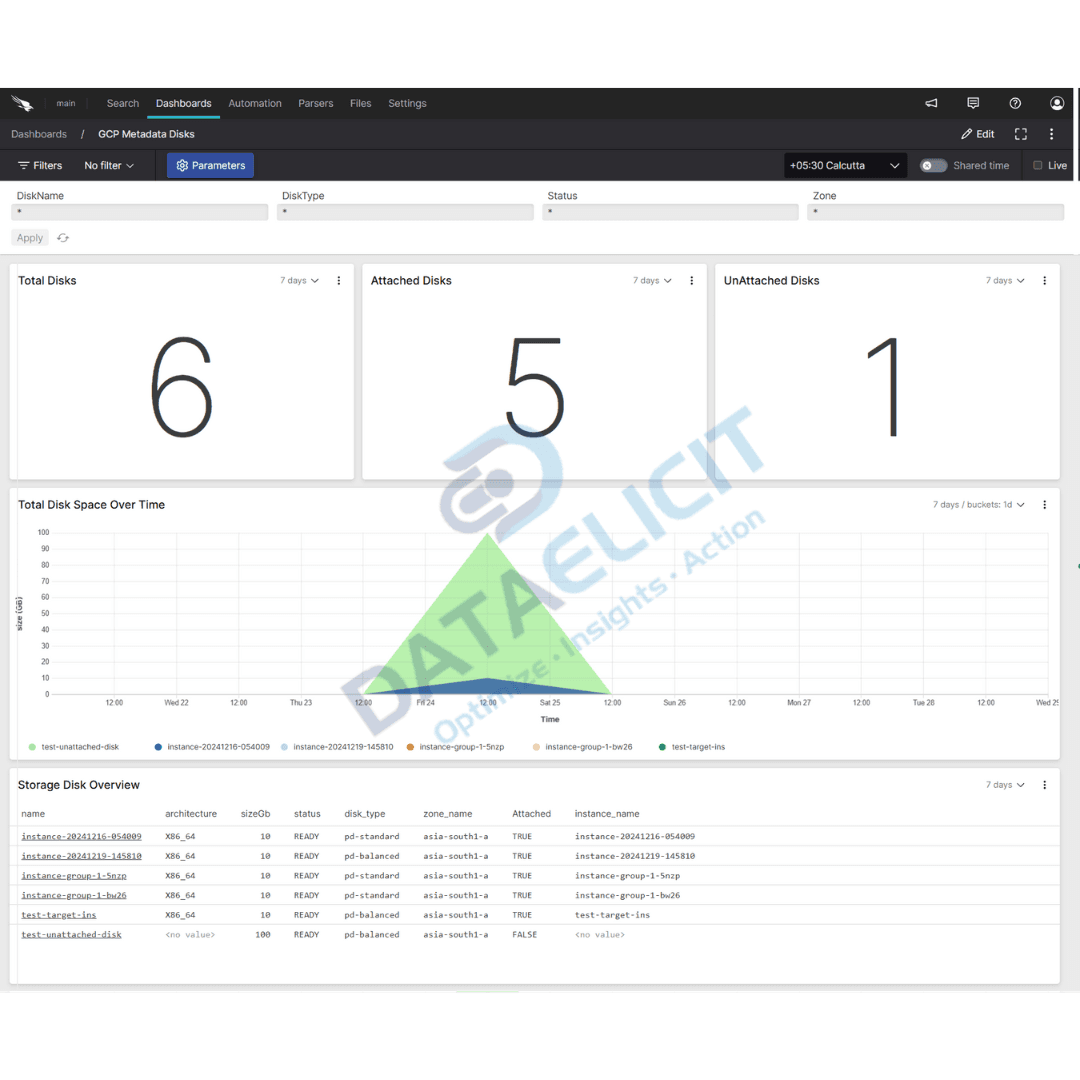
- ✓Metadata for your GCP compute, VPC, storage, Kubernetes and more so you can slice by project, service and environment.
Once these feeds are standardized and indexed, the Falcon LogScale dashboards for GCP act as a shared console for SRE, security and platform teams. You can investigate incidents, watch resource usage and validate controls with the same set of panels instead of hopping between Cloud Console tabs.
Conclusion
Efficient cloud administration is about more than keeping dashboards green. With Falcon LogScale plus LogConnector and the GCP connector, you get a repeatable way to ingest, analyze and act on Google Cloud logs. Instead of wrestling with exports and custom parsers, your teams work from a single data model and a single log platform, which makes investigations and operations far less fragile.
Ready to dive deeper?
The examples here focus on the basics. In real projects, we help teams tune routing, index layouts and dashboards so GCP data lines up with how their environments are segmented across projects, folders and business units.
With LogConnector managing how Google Cloud telemetry lands in Falcon LogScale, you get predictable ingestion, faster queries and cleaner visibility across your cloud estate. That is when GCP logs stop being an afterthought and become a core signal for reliability and security work.
Get in touch with us today
to learn more about:
- ›LogConnector features and benefits
- ›The GCP connector and its capabilities
- ›How LogConnector and Falcon LogScale enhance IT and security operations
Featured Articles
Explore more guides, integrations and use cases powered by LogConnector and Falcon LogScale.

Route 1Password Logs to CrowdStrike Falcon LogScale with LogConnector
Protect sensitive access data by routing 1Password logs into Falcon LogScale with clean schemas and ready to use dashboards.
Read More
Route GitHub Logs to CrowdStrike Falcon LogScale with LogConnector
Bring Github audit and activity logs into Falcon LogScale to tighten software supply chain visibility.
Read More
Route Okta Logs to CrowdStrike Falcon LogScale with LogConnector
Normalize Okta identity telemetry with LogConnector and correlate it with endpoint and network data in Falcon LogScale.
Read More